Independent data platform for grid congestion
Follow your portfolio.
Find your next opportunity.
Follow what changes around your existing sites, or find where you can connect in time.
Existing portfolio
Follow your sites
Queue, expected relief year and permits for each site, with the date of every publication.
New opportunities
Opportunity Scan
Tell us what you want to build, where and when. The scan sets every area in the Netherlands against your year and marks it as on time, tight or later.
Your whole team can take part. In the demo we look at your own sites and set up a scan with your criteria.
What you see
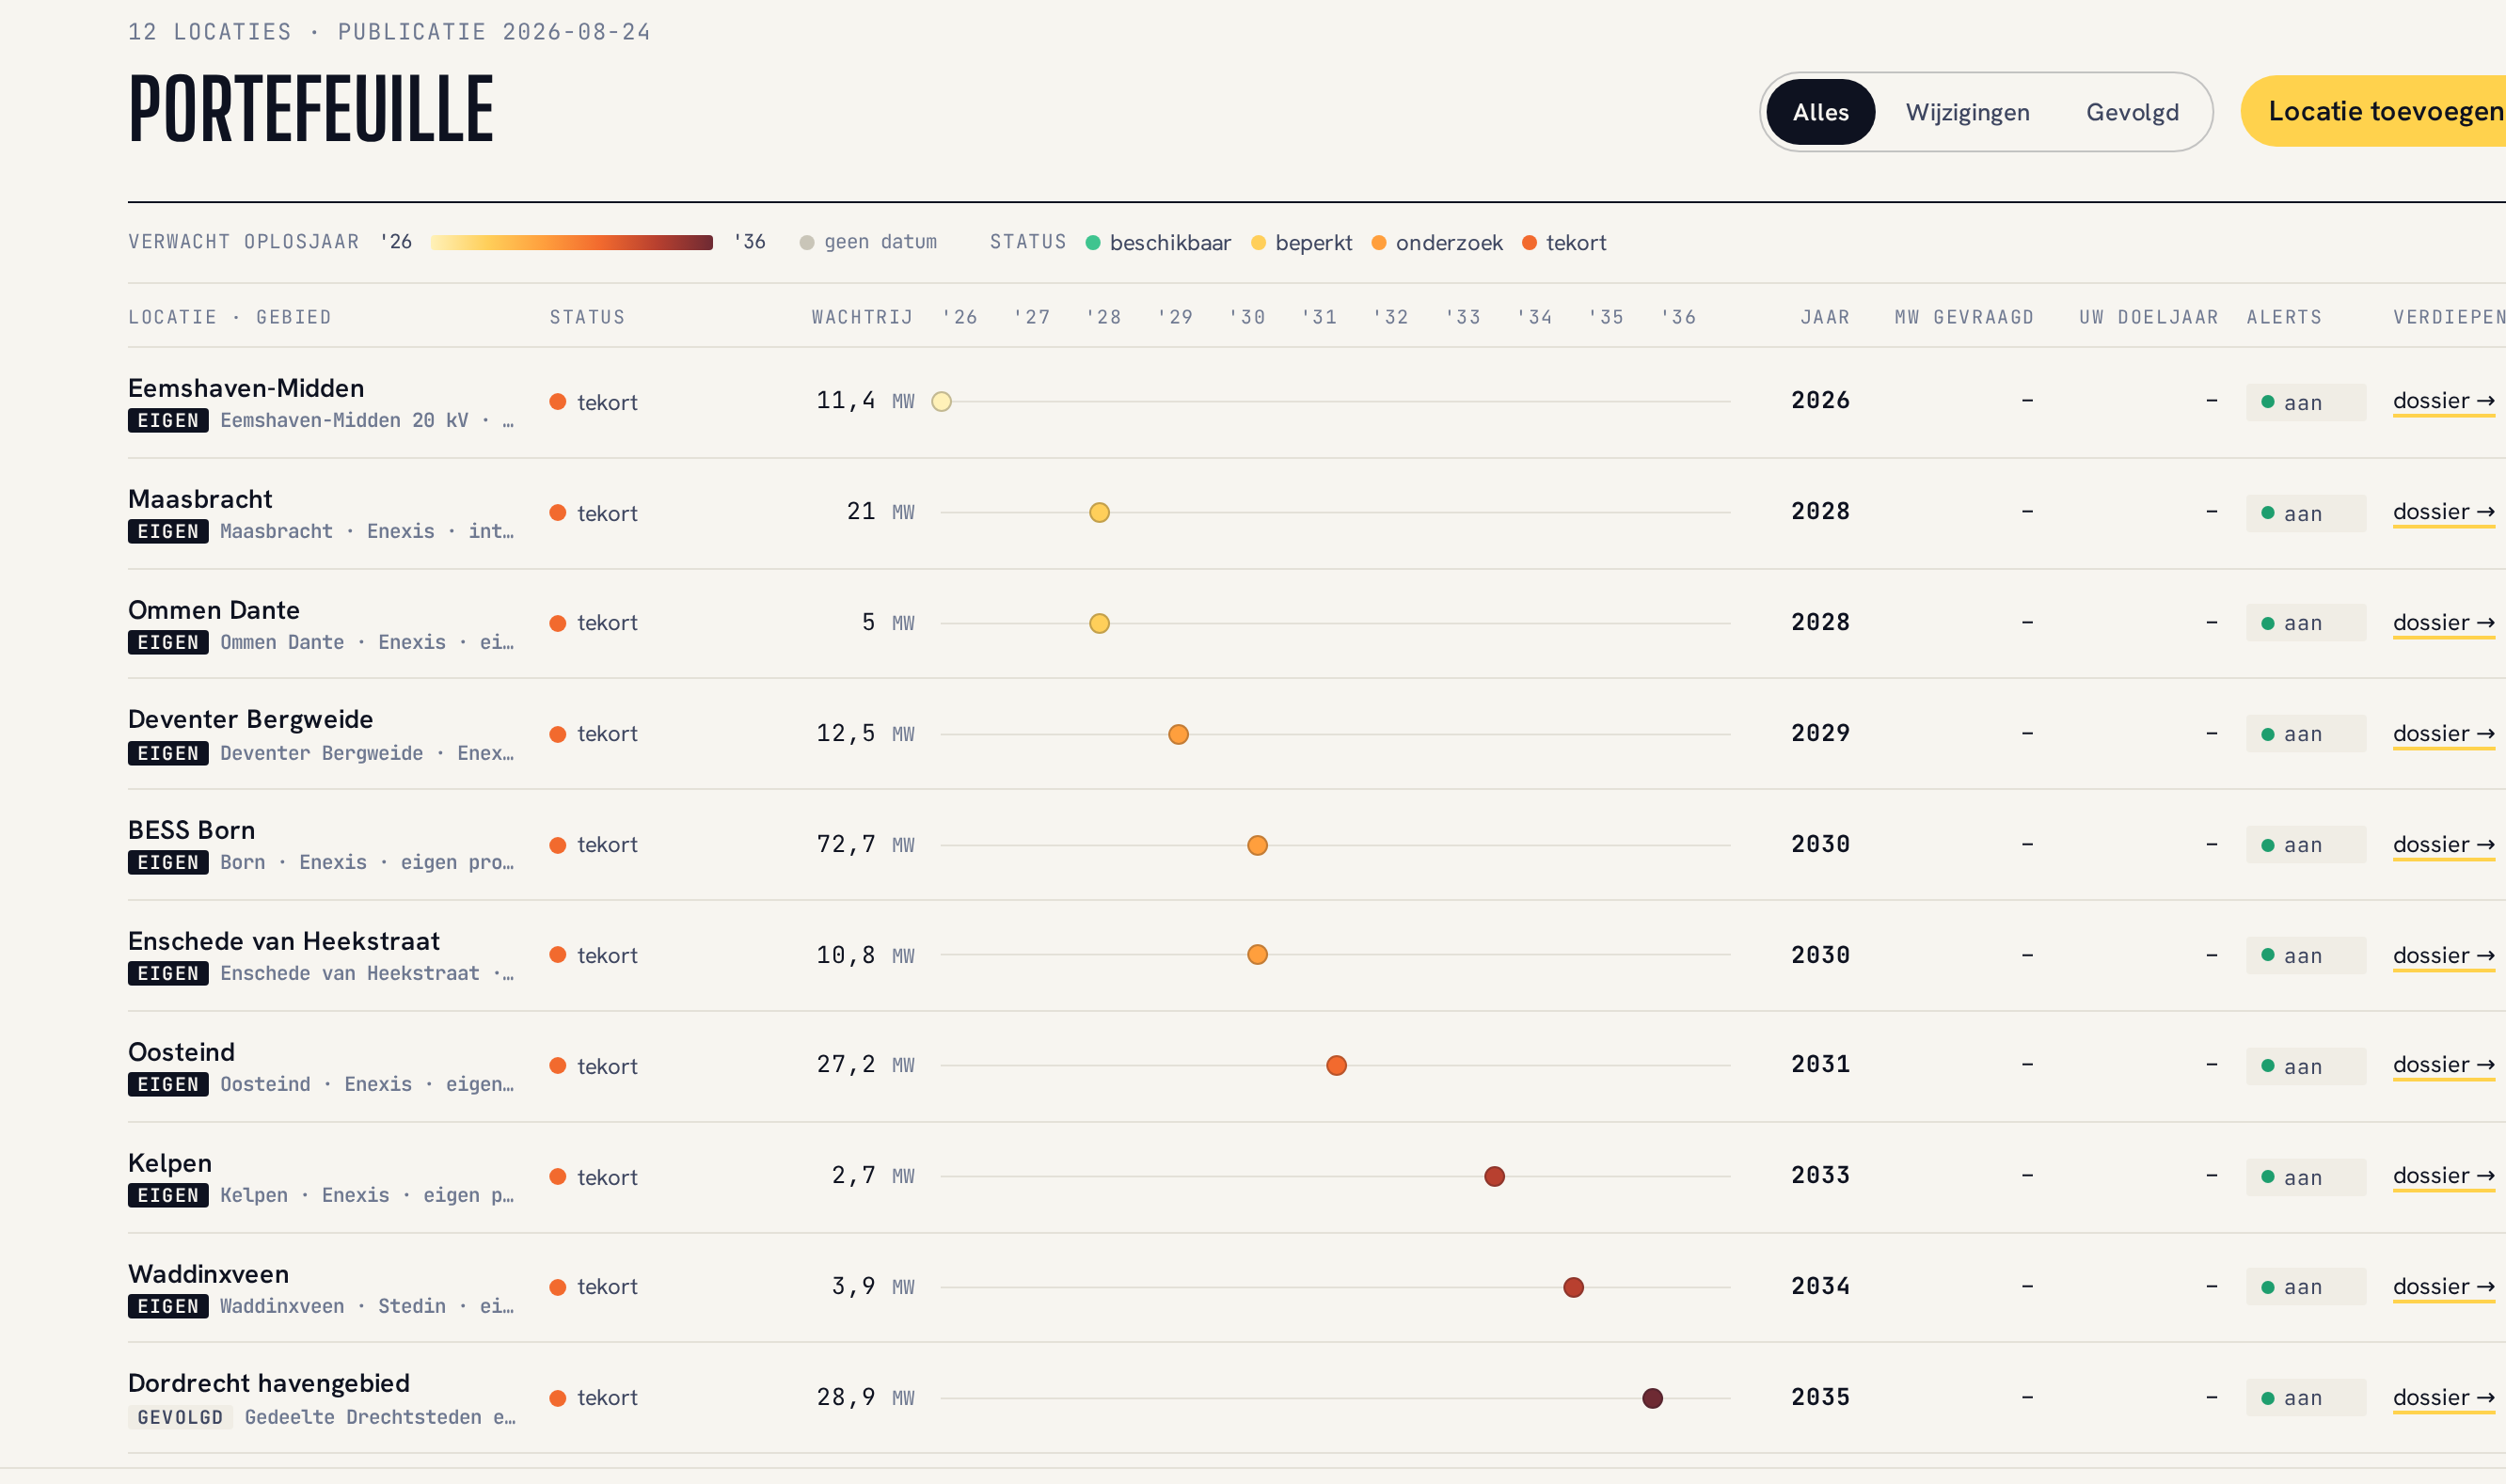
Your portfolio on one screen, with a file for every site.
A table of your sites with the published relief year on a timeline, and for each site a file with everything that changed since your first day. You no longer have to search the map yourself.
Portfolio
Status, queue and expected relief year for each site, sorted by the year that affects you most. Alerts on or off per site. Changes as a filter.
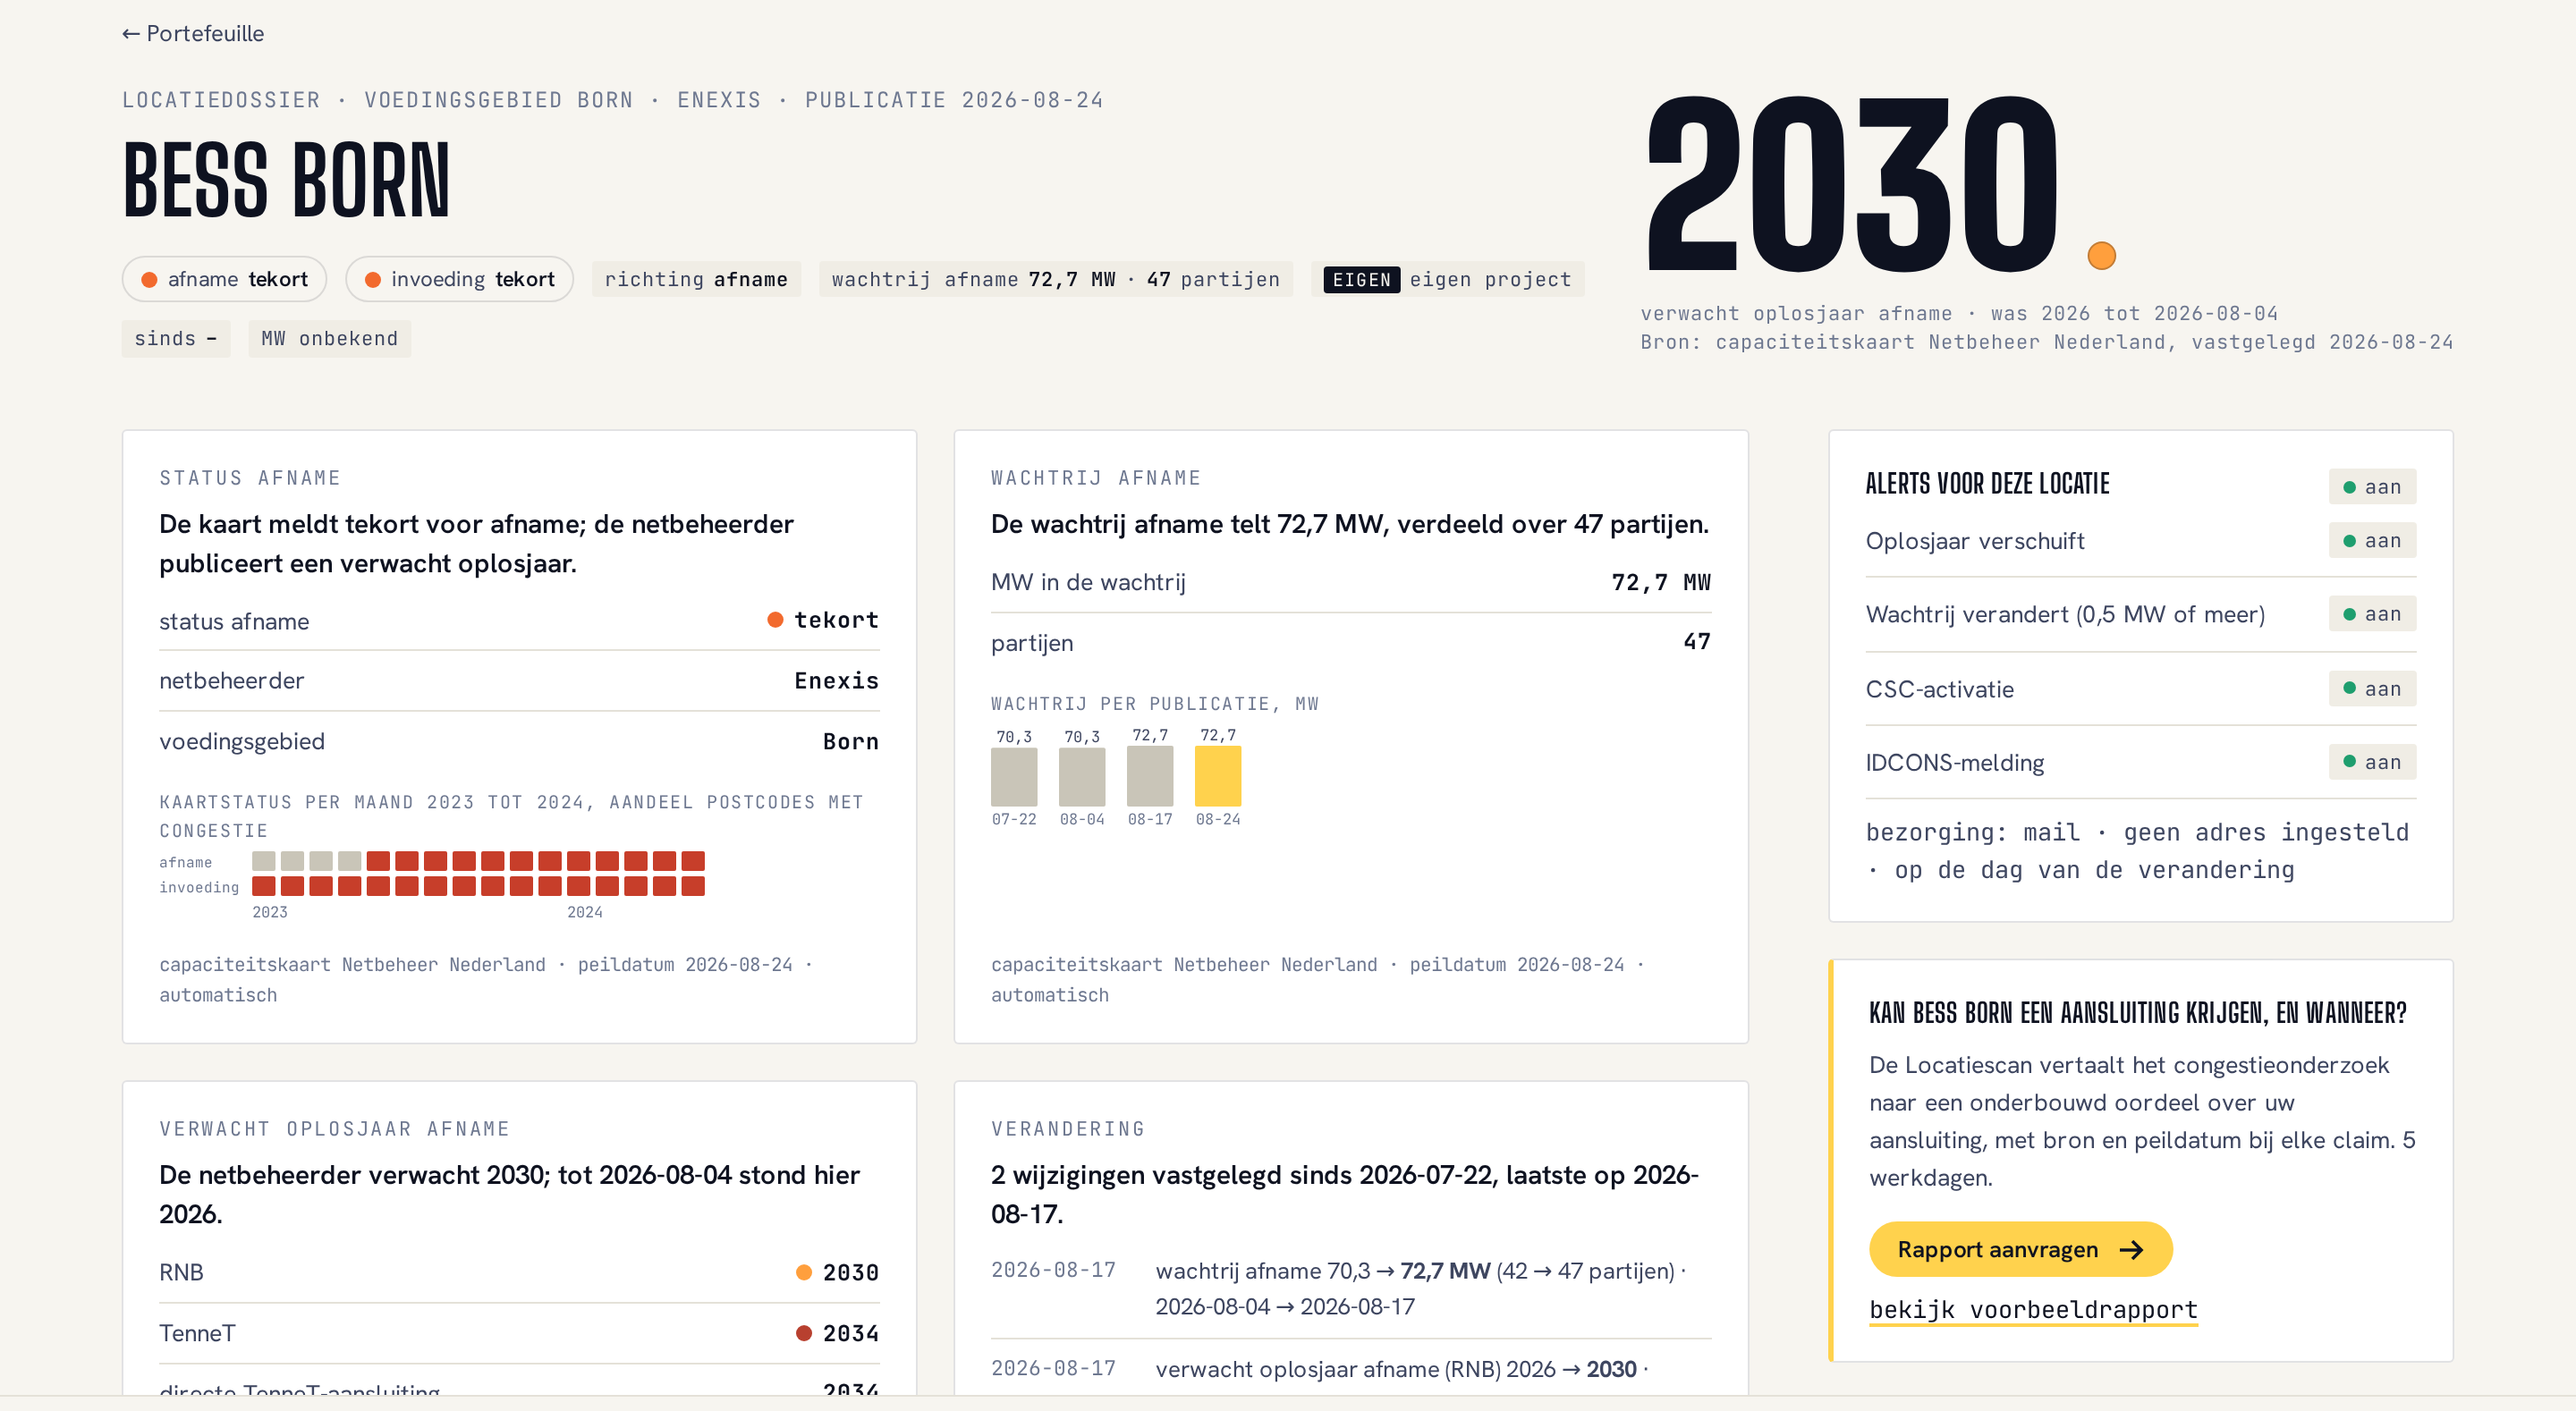
Site file
The relief year in large type, with what it said before and until when. Below it the change log per publication, the planned grid reinforcement and the permits nearby. Every line has its source and date.
Opportunity Scan
Find your next development site or customer.
Grid congestion affects where you can develop and where companies need your services. Search with criteria that fit your projects.
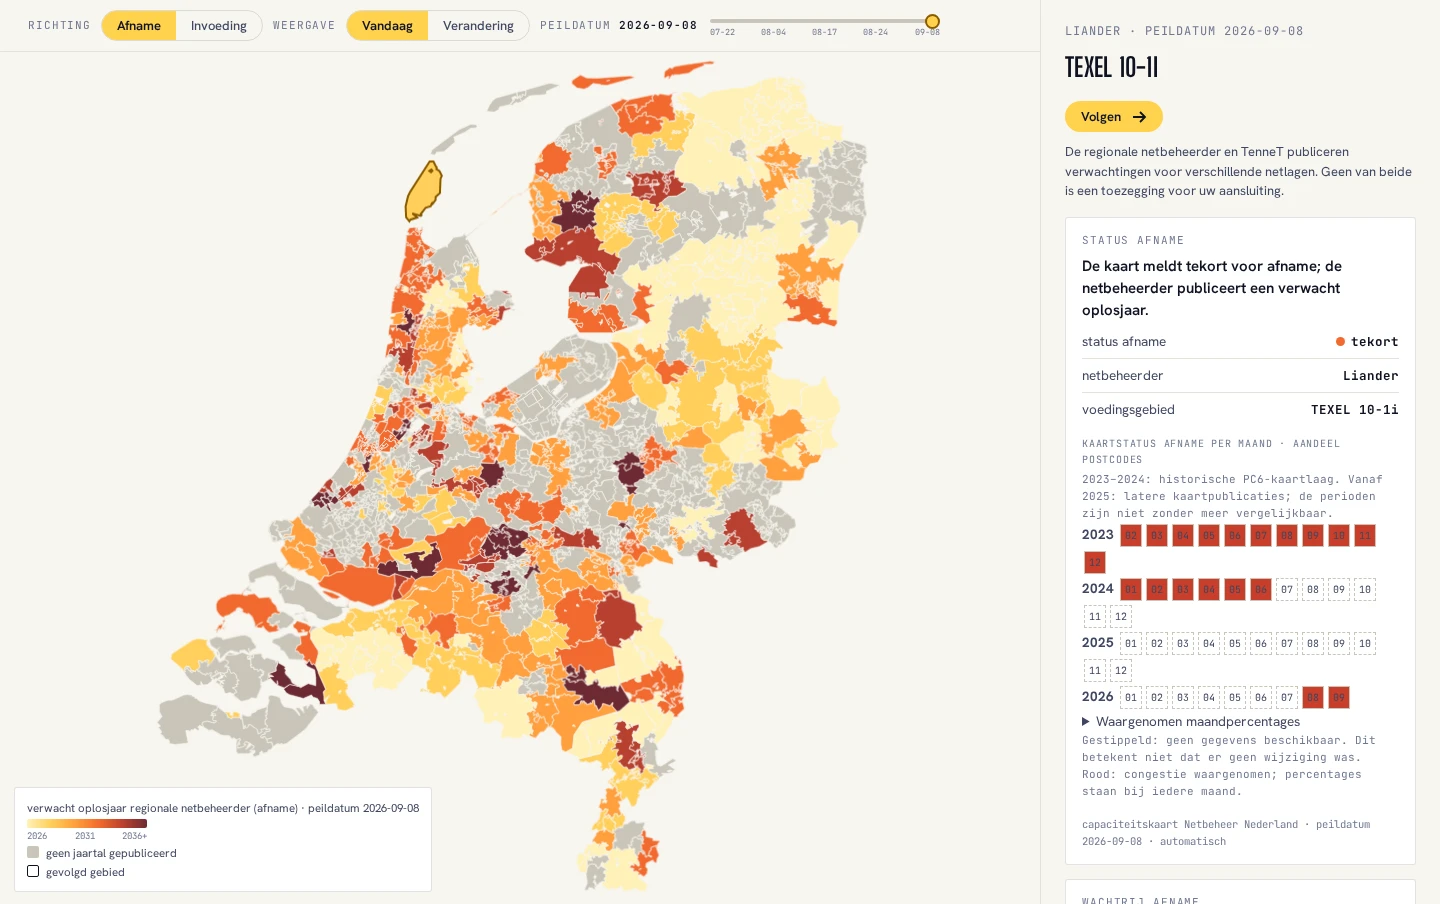
Explore areas on the map.
See the grid data around possible sites. Click an area for its published status, queue and expected relief years.
Set your criteria
Choose region, required capacity, offtake or feed-in, and timing.
Review possible sites
Compare published capacity, queues and expected relief years. See which constraints still need attention.
Follow your selection
Add relevant sites to your portfolio and follow the changes that could affect your next step.
A search result calls for further assessment of your project and consultation with the grid operator.
Who it is for
Anyone with more sites than time to check the map.
The public analyses on congestio.com are free and aggregated. Congestio links changes to your own sites.
Developers with a pipeline
"Which of our sites moved this week?"
- Battery, solar, wind and charging: your own projects, options and competitors in one list
- Offtake and feed-in, regional grid and TenneT
Owners of several sites
"Where can we still electrify next year?"
- Distribution centres, shops, factories, housing sites, healthcare and education buildings
- Heat pump, charging hub or solar roof: for each site, whether the grid allows it and when
Funds and lenders
"Is the connection date in the deck still right?"
- The portfolio of a portfolio company, followed after financial close
- Every shift in a relief year, with both publications
How it works
Sites in, signals out.
Three steps, in this order. The first takes you fifteen minutes; we do the other two.
You send your sites
Address, postcode or list. We link each site to its supply area and substation on both grid layers, and set the direction to offtake or feed-in.
We check every new publication
Each change shows the previous and the new publication, with date and source, so you see what changed for your sites.
You get signals and site files
Receive alerts on relevant changes and see the source, publication date and change for each site. Share the overview with your colleagues.
Demo
Thirty minutes, with your own sites.
Send three to five addresses if you like, and your portfolio will already be in Congestio when we call. We also show how to set criteria for the Opportunity Scan.
Relief dates are expectations published by the grid operator, and Congestio shows them as such. Sources: Netbeheer Nederland capacity map, GOPACS, officielebekendmakingen.nl.